Remote Unreal Editor plugin
Stream the Unreal Editor itself to a browser, and work in it from anywhere — including setting Blueprint breakpoints and hitting them on the remote machine.
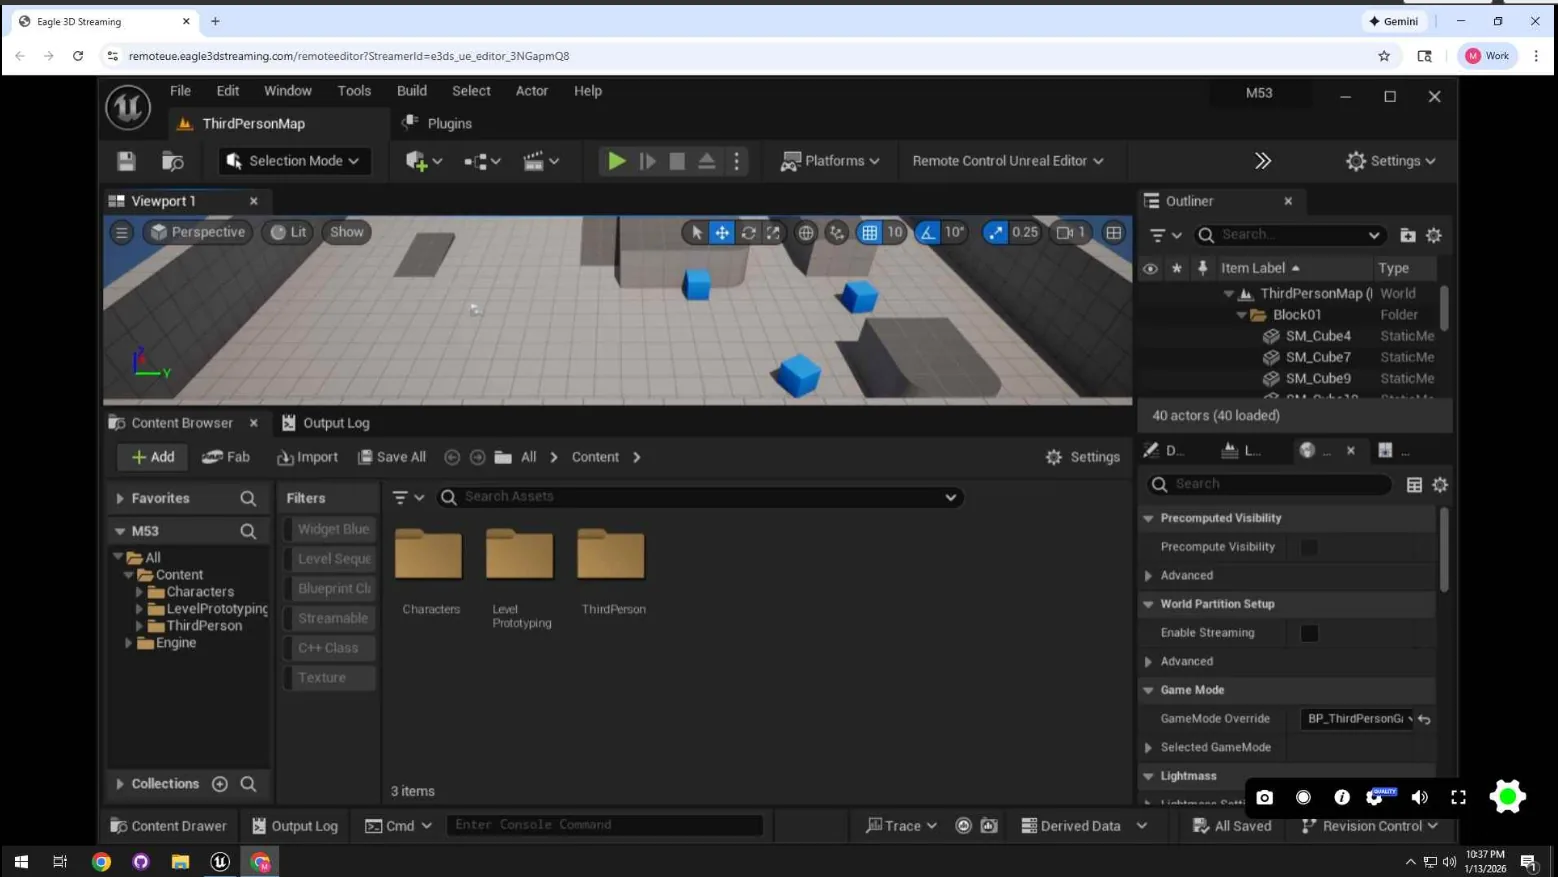
Everything else on this site streams a packaged app. This streams the editor: the machine runs Unreal, you get the full editor in a browser tab, and you build in it as if you were sitting at that machine. One toolbar toggle starts the session — no signalling server to configure, no ports to open.
A workstation you cannot sit at: a GPU machine in an office you are not in, a cloud box far stronger than your laptop, or a review where a colleague needs to see the project without installing Unreal and pulling the repo.
Unreal Engine 5.3 to 5.8, and the plugin from Fab. Restart the editor after installing.
Turn it on
-
Open your project, then Edit → Plugins and search for UnrealEditorRemoteControl — one word, as the Plugins list shows it. Do not enable Epic's similarly named Remote Control API; that is a different plugin.
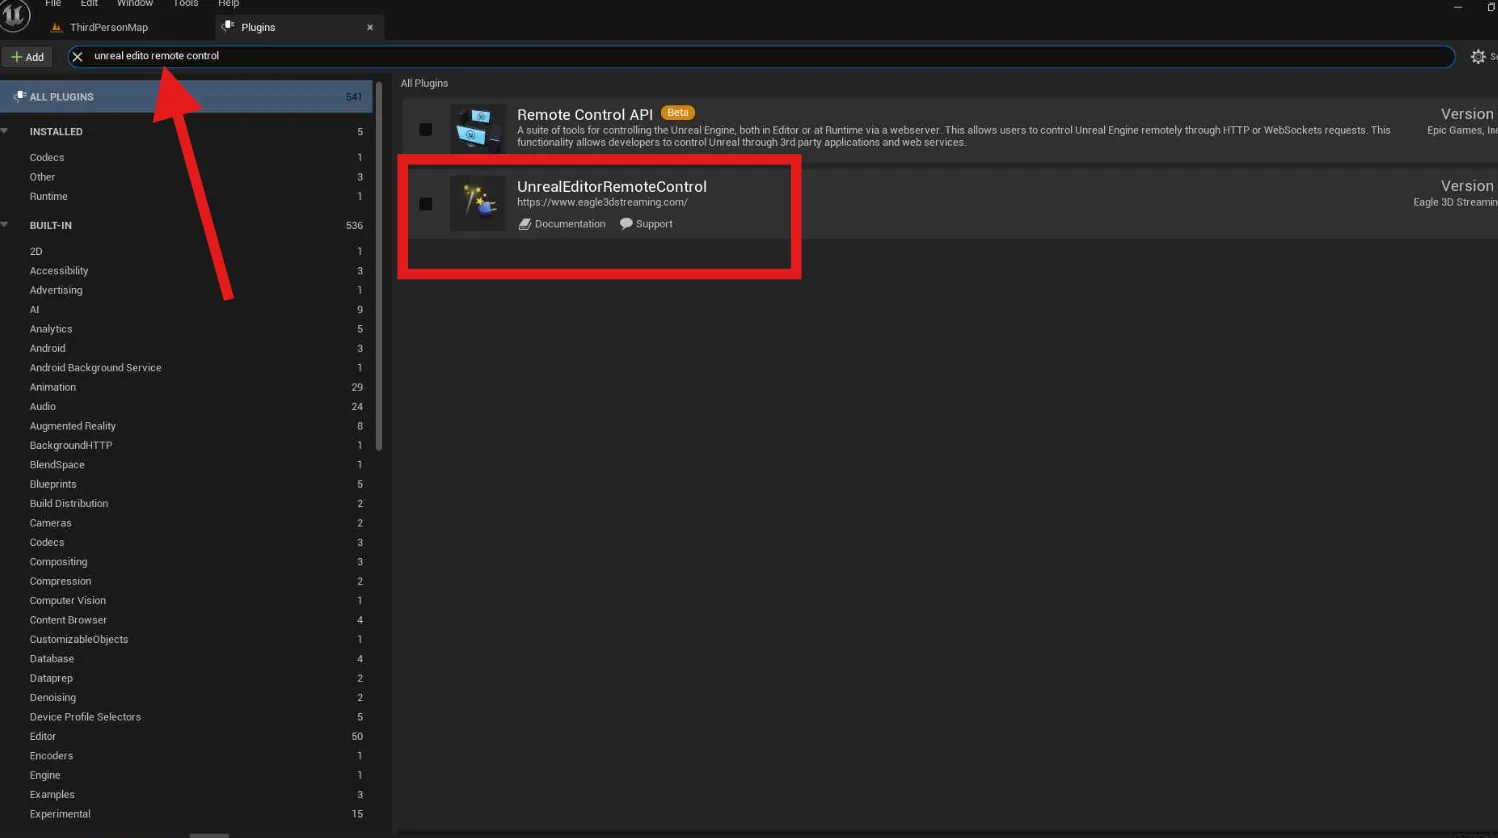
-
Enable it, confirm, and restart the editor when prompted.
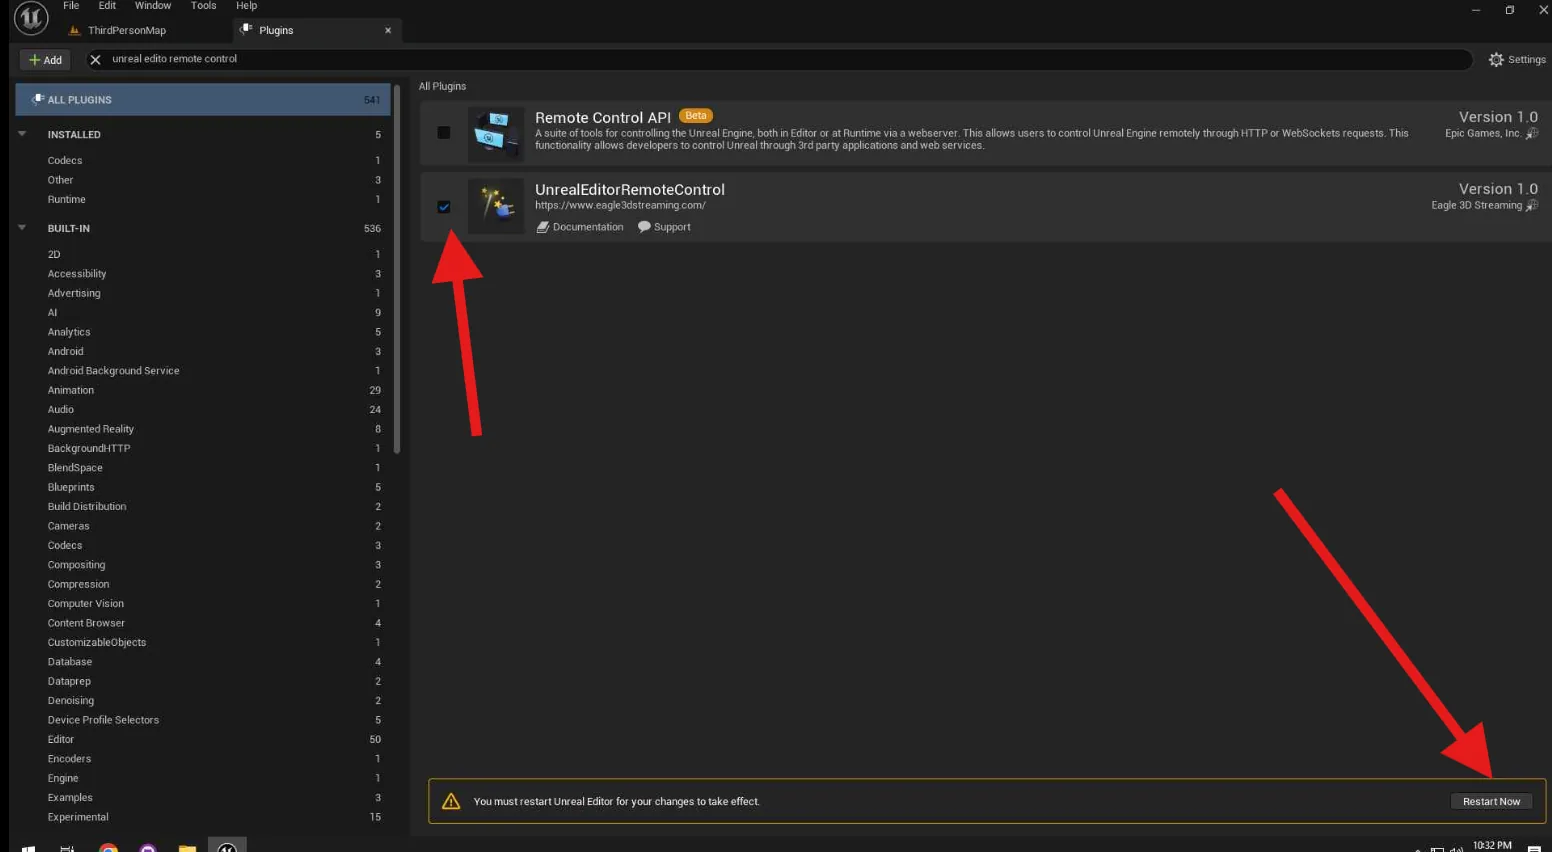
-
Open the Remote Control Unreal Editor dropdown in the toolbar and tick Allow Remote Control.
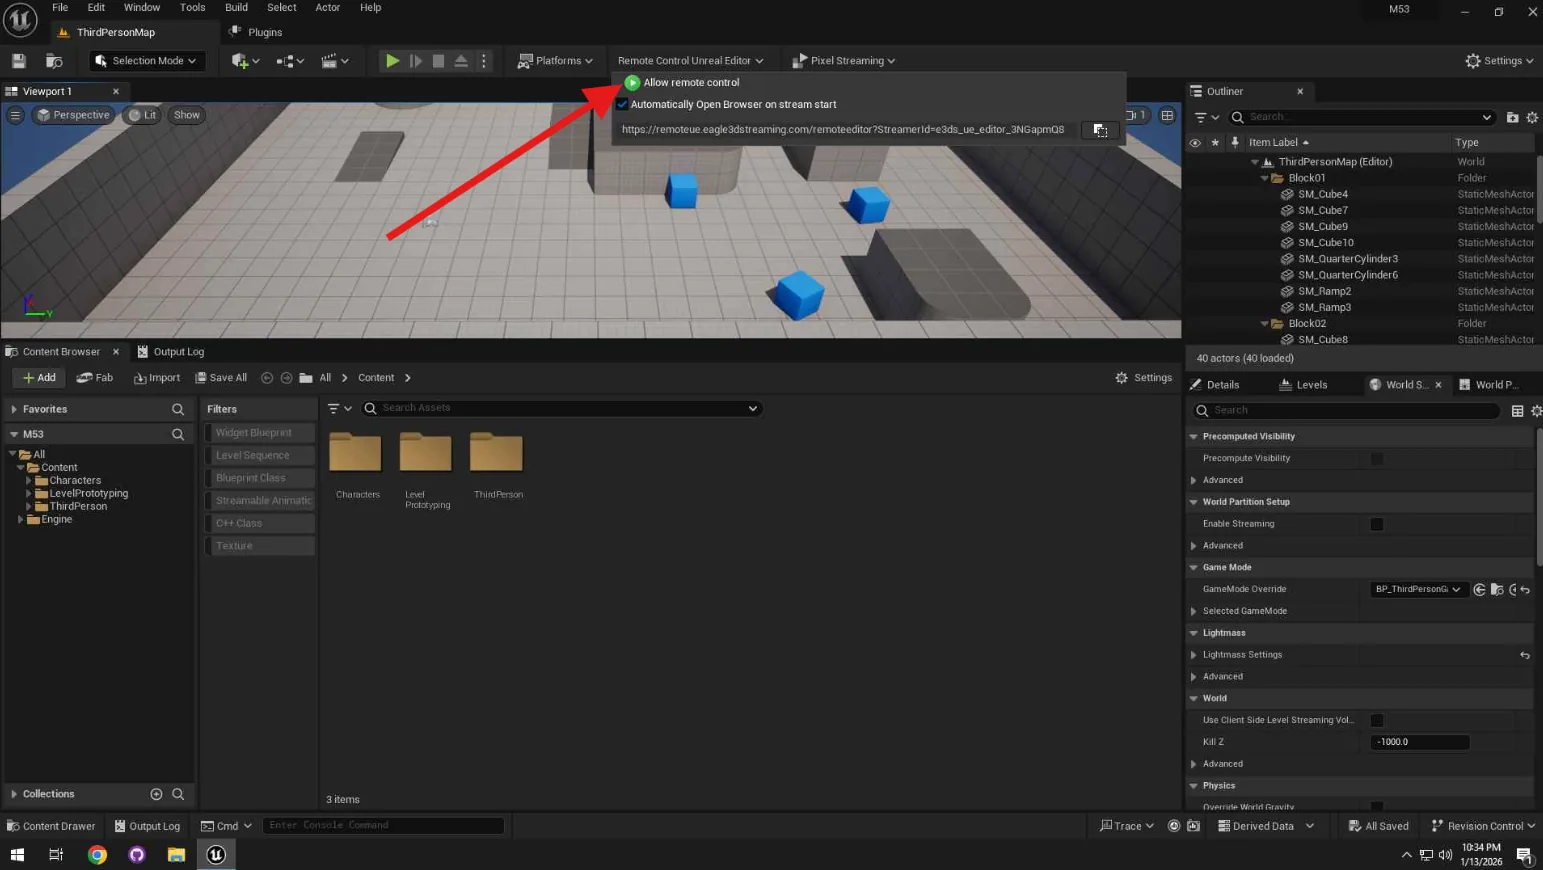
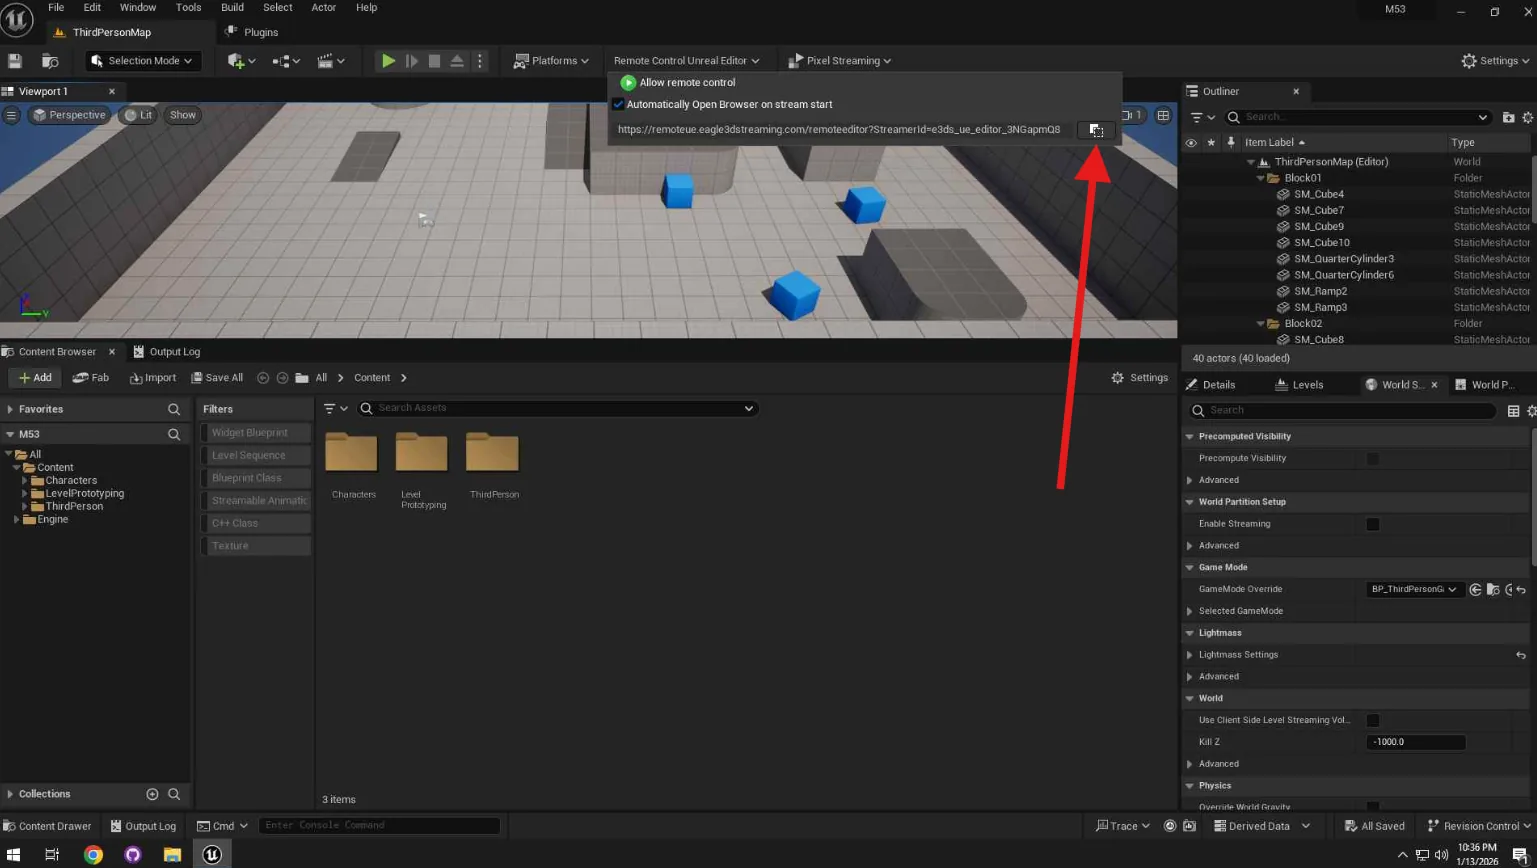
By default that starts the stream and opens your browser on it immediately. If you would rather have the URL and open it yourself — on another device, say — turn off Automatically Open Browser on Stream Start and copy the generated URL.
Debugging Blueprints over the stream
Breakpoints work exactly as they do locally, which is the part people do not expect. If a Blueprint is not behaving, you can stop it on the remote machine and inspect it.
In the streamed editor, open the Blueprint you want to debug and find the node you suspect.
-
Right-click that node and choose Add Breakpoint. A solid red octagon appears on it.
-
Go back to the viewport and trigger the event.
The session pauses, the view switches to the Event Graph, and a red arrow points at your node. Hover any input or output pin to read its value at that moment. If it never pauses, the event is not reaching that node at all — which is itself the answer.
Video walkthrough — the debugging section starts at 2:39.
Running your packaged app against a signalling server before you upload it.
Last updated